This site uses cookies to offer you a better browsing experience. By continuing to use this site, you agree to our use of cookies. Find out more on how we use cookies.

This site uses cookies to offer you a better browsing experience. By continuing to use this site, you agree to our use of cookies. Find out more on how we use cookies.

This site uses cookies to offer you a better browsing experience. By continuing to use this site, you agree to our use of cookies. Find out more on how we use cookies.

Performance Indicators

Performance indicators of Austrian tourism have been set to evaluate development in all three dimensions of sustainability – ecological, economical, and sociocultural.
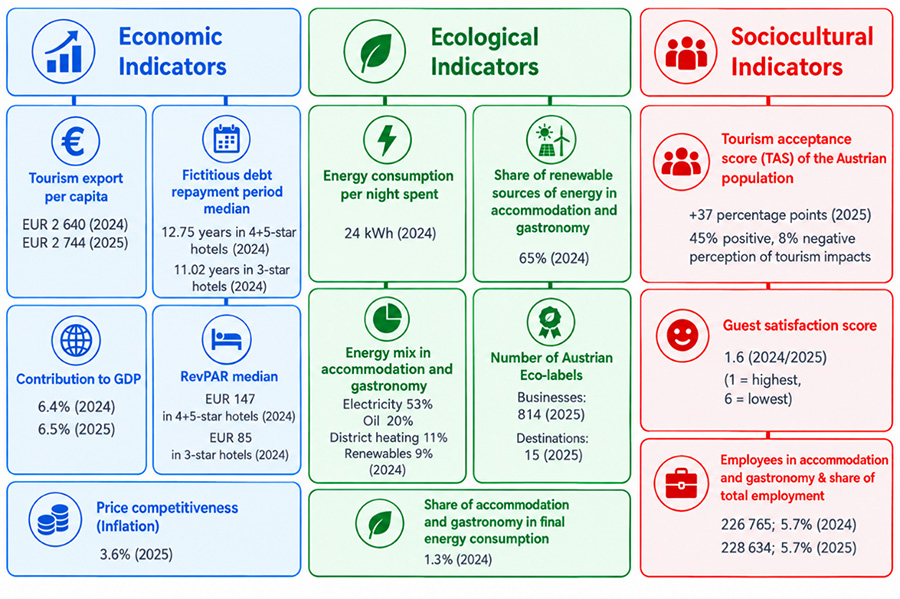
Tourism export per capita 	 EUR 2,640 (2024) EUR 2,744 (2025)  Fictitious debt repayment period median	 12.75 years in 4+5-star hotels (2024) 11.02 years in 3-star hotels (2024)  Contribution to GDP 	 6.4% (2024) 6.5% (2025)  RevPAR median 	 EUR 147 in 4+5-star hotels (2024) EUR 85 in 3-star hotels (2024)  Price competitiveness (Inflation)	  3.6% (2025)  Energy consumption per night spent 24 kWh (2024) 	  Share of renewable sources of energy in accommodation and gastronomy	 65% (2024)  Energy mix in accommodation and gastronomy		 Electricity 53% Oil 20% District heat 11% Renewables 9% Gas 7% (2024) Number of Austrian Ecolabels		 Businesses: 814 (2025) Destinations: 15 (2025)  Share of accommodation and gastronomy in final energy consumption 	 1.3% (2024)  Tourism acceptance score (TAS) of the Austrian population	 +37 percentage points (2025)  45% positive, 8% negative perception of tourism impacts  Guest satisfaction score 1.6 (2024/2025)   (1 - highest, 6 - lowest)  Employees in accommodation and gastronomy & share of total employment 226,765; 5.7% (2024) 228,634; 5.7% (2025)
Performance Indicators in the Tourism Industry in Austria photo: BMWET

Indicators and Targets for Vision T

With Vision T additional indicators were introduced in 2026 that will be monitored in the future: Equity ratio of high-quality hotels, CO₂-emissions in accommodation and gastronomy, share of overnights in off-season.
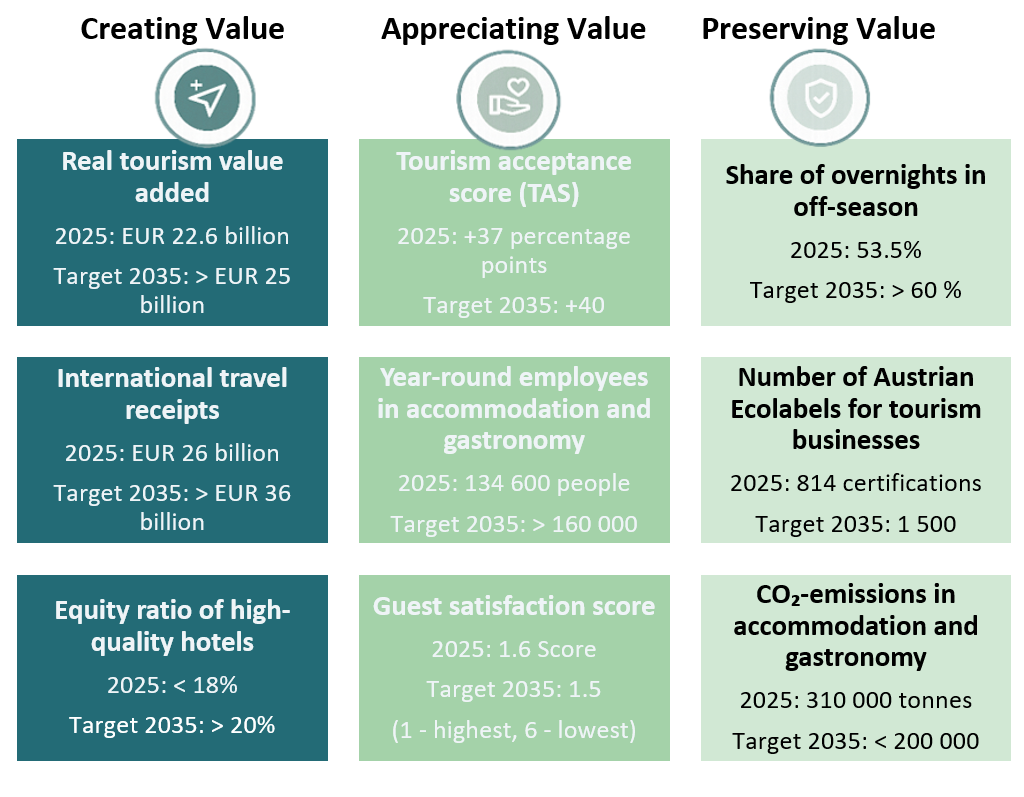
Real tourism value added 2025: EUR 22.6 billion Target 2035: > EUR 25 billion Tourism acceptance score (TAS) 2025: +37 percentage points Target 2035: +40   Share of overnights in off-season 2025: 53.5% Target 2035: > 60 % International travel receipts 2025: EUR 26 billion Target 2035: > EUR 36 billion Year-round employees in accommodation and gastronomy 2025: 134 600 people Target 2035: > 160 000 Number of Austrian Ecolabels for tourism businesses 2025: 814 certifications Target 2035: 1 500 Equity ratio of high-quality hotels 2025: < 18% Target 2035: > 20% Guest satisfaction score 2025: 1.6 Score Target 2035: 1.5 (1 - highest, 6 - lowest) CO₂-emissions in  accommodation and gastronomy 2025: 310 000 tonnes Target 2035: < 200 000
Indicators and Targets for Vision T photo: BMWET

RESY-Dashboard
 

Following a pilot project implemented in two tourism regions on “Regional Information and Monitoring Systems” (RESY), a publicly accessible dashboard has been developed as a continuous monitoring and management tool. The dashboard provides data at the municipal level through 30 core indicators, covering a broad range of tourism-related aspects, including visitor numbers, business activity, labour market developments, mobility patterns and environmental indicators (www.resy-dashboard.at).